Research Summary
Nowadays, here is a new trend in the area of Artifitial Intelligence. Researchers from academic communities and industries try their best to filter meaningful informations from masses of data. Topics like Neural Networks, Social Network Modeling renew their youth after decades. Visualization is also another efficient way to discover knowledges in data based on the fact that human brain has a strong visual perceptual ability. The key idea is to convey information to people.
As a part of data visualization, graph analysis is crucial in many areas including sociology, finance, biology, and software engineering. The main objectives are understanding the global and local structure of the graph and how graph evolves over time. Visualization is a powerful tool which can help graph analysts obtain knowledge in graphs by providing an intuitive visual presentation. However, graph visualization is challenging due to the following reasons: 1) As the graph size increases, common graph visualization methods encounter the scalability problem. The clutter results generated by these methods prevent people from gaining insight in graphs. 2) Many real-world graphs are dynamic. Identifying, tracking, and understanding changes in dynamic graphs are challenging and add an additional level of complexity to graph analysis. My research interest is concerned with solving these challenges in graph visualization and helping people better understand the graph structures and its temporal changes.
Interests
- Information Visualization
- Graph Visualization
- Social Network Analysis
- Human-Computer Interaction
Research Projects
-
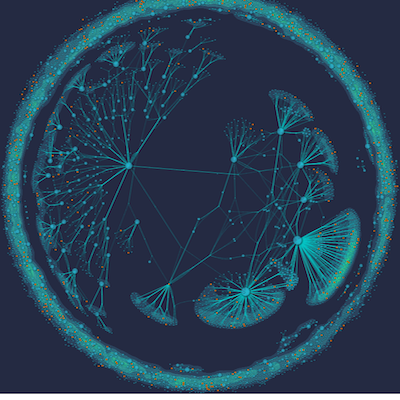
Current graph visualization technologies can only support relatively small data whose nodes number is lower than ten thousand. Therefore, there is a need to develop a new graph visualization method which can support millions of nodes in the graph.